

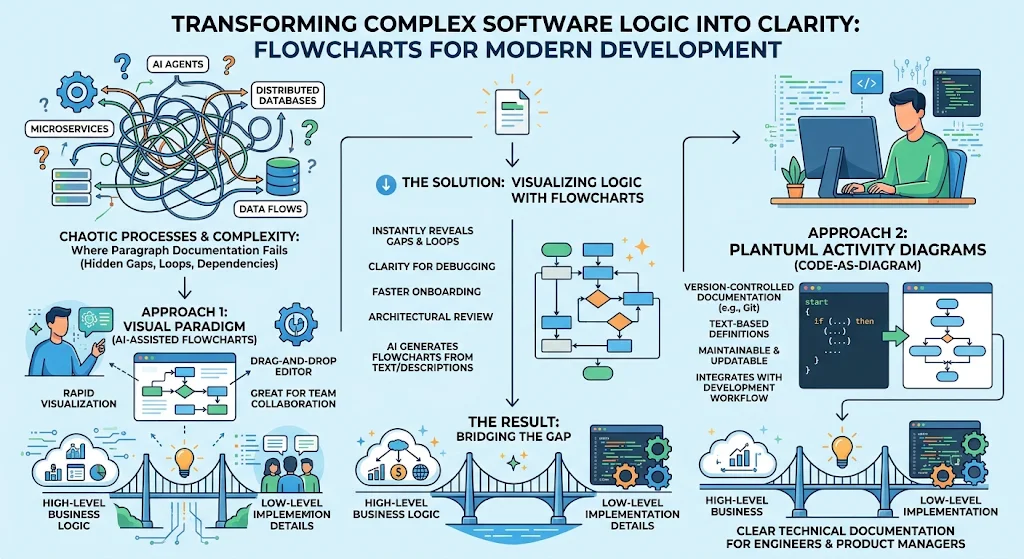
In the modern software development lifecycle, clarity is currency. As systems grow in complexity—spanning microservices, AI agents, and distributed databases—the ability to visualize logic becomes critical for debugging, onboarding, and architectural review. While traditional paragraph-based documentation often fails to capture branching logic and state transitions effectively, flowcharts provide a visual map that reveals gaps, loops, and dependencies instantly.
This guide explores how to transform chaotic processes into clear diagrams using two powerful approaches: leveraging Visual Paradigm’s AI-assisted features for rapid visualization and utilizing PlantUML Activity Diagrams as code-as-diagram solutions for version-controlled, maintainable technical documentation. By combining these tools, engineers and product managers can bridge the gap between high-level business logic and low-level implementation details.
Key Concepts of Effective Flowcharting
Before diving into tools, it is essential to understand the foundational principles that make a flowchart useful rather than just decorative.
1. The Power of Visual Sequencing
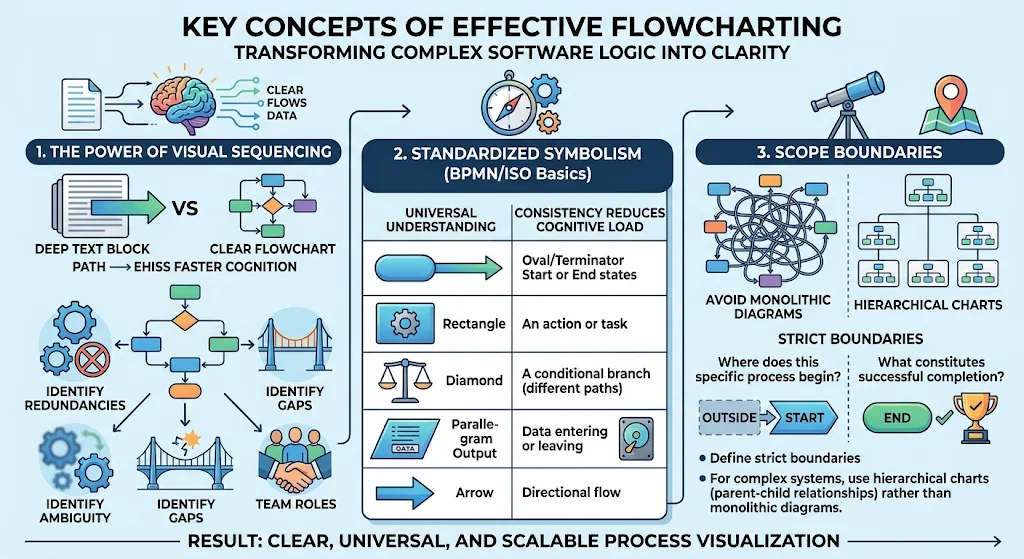
Human cognition processes visual sequences faster than dense text blocks. A well-structured flowchart separates a process into manageable steps, making relationships between actions explicit. This visibility helps identify:
-
Redundancies: Tasks repeated unnecessarily.
-
Gaps: Decision points with no defined outcome.
-
Ambiguity: Steps where responsibility is unclear between teams.
2. Standardized Symbolism (BPMN/ISO Basics)
Consistency reduces cognitive load. Regardless of the tool used, adhering to standard shapes ensures universal understanding:
-
Oval/Terminator: Start or End states.
-
Rectangle/Process: An action or task.
-
Diamond/Decision: A conditional branch leading to different paths.
-
Parallelogram/Input-Output: Data entering or leaving the system.
-
Arrow/Connector: Directional flow.
3. Scope Boundaries
A common mistake is trying to document everything in one chart. Effective flowcharts define strict boundaries: Where does this specific process begin? and What constitutes its successful completion? For complex systems, use hierarchical charts (parent-child relationships) rather than monolithic diagrams.
Using PlantUML Activity Diagrams for Simple Flowcharting
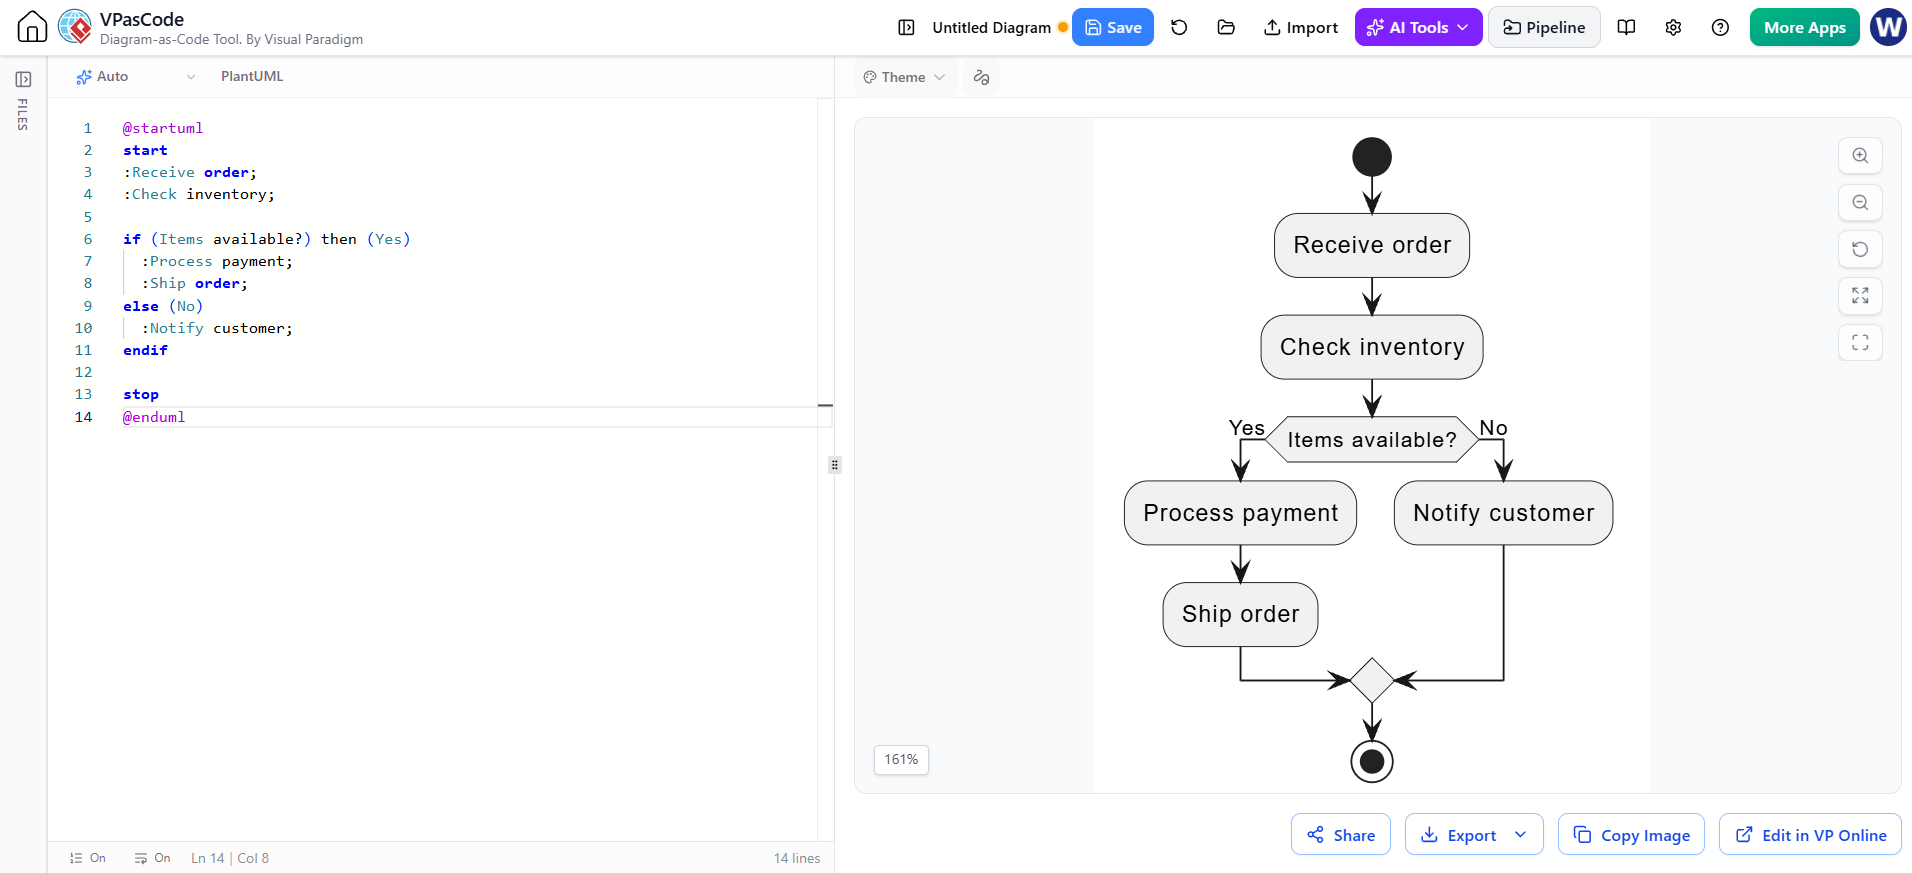
PlantUML Activity Diagrams work well for simple flowcharts when you stick to basic notation: a start and end point, activity steps, arrows, and decision branches. This keeps the diagram easy to read and the source easy to maintain alongside code or documentation. For example, the order process below shows a straightforward path with one decision:
Render the flowchart with VPasCode Tool:
@startuml
start
:Receive order;
:Check inventory;

if (Items available?) then (Yes)
  :Process payment;
  :Ship order;
else (No)
  :Notify customer;
endif

stop
@enduml
PlantUML Activity Diagrams also support richer constructs, such as loops, parallel paths, and swimlanes. Use those when the process needs more detail. If you need formal BPMN notation—such as BPMN-specific events, tasks, and gateways—use a BPMN-capable tool or extension rather than treating a basic activity diagram as a BPMN diagram.
Methodology 1: Rapid Visualization with Visual Paradigm + AI
For non-technical stakeholders or early-stage brainstorming, speed and ease of use are paramount. Visual Paradigm Online (VP Online) integrates AI assistance to convert natural language descriptions into structured diagrams automatically.
How It Works
Instead of manually dragging and dropping shapes, users can describe the process in plain English. The AI parses the intent, identifies decision nodes, and generates the initial layout.
Step-by-Step Workflow
-
Define the Narrative: Write down the process steps in bullet points.
-
Example: “User logs in -> System checks credentials -> If valid, redirect to dashboard; if invalid, show error message.”
-
-
AI Generation: Input this narrative into VP’s AI diagram generator. Select “Activity Diagram” or “Flowchart” as the target format.
-
Refinement: Review the generated chart. Adjust symbol types (e.g., ensuring decisions are diamonds) and refine labels for clarity.
-
Collaboration: Share the live link for real-time feedback from team members.
Use Case Example: Onboarding Process
Imagine designing an employee onboarding workflow. Using VP AI, you input: “New hire receives welcome email -> Fills out tax forms -> HR reviews forms -> If incomplete, return to new hire; if complete, schedule training session.” The AI instantly renders this structure, allowing HR to focus on optimizing the flow rather than formatting the diagram.
Methodology 2: Code-Based Diagramming with PlantUML Activity Diagrams
For engineering teams, diagrams must evolve with the codebase. Static images break when requirements change. PlantUML, specifically its Activity Diagram Beta syntax, allows developers to write flowcharts as code. This enables version control (Git), automated CI/CD integration, and precise representation of concurrent threads and swimlanes.
Why PlantUML?
-
Version Control: Changes are tracked via commit history.
-
Reusability: Snippets can be included across multiple documents.
-
Precision: Supports advanced concepts like fork/join, swimlanes, and conditional looping that basic flowchart tools struggle with.
Enhanced Syntax Features
While basic flowcharts handle linear steps, PlantUML supports complex programming constructs:
-
Swimlanes (
|Lane|): Assign responsibilities to specific actors or services. -
Fork/Join (
fork ... end fork): Represent parallel execution paths. -
Repeat/While Loops: Clearly depict iterative processes.
-
Notes & Comments: Embed contextual information directly within the code structure.
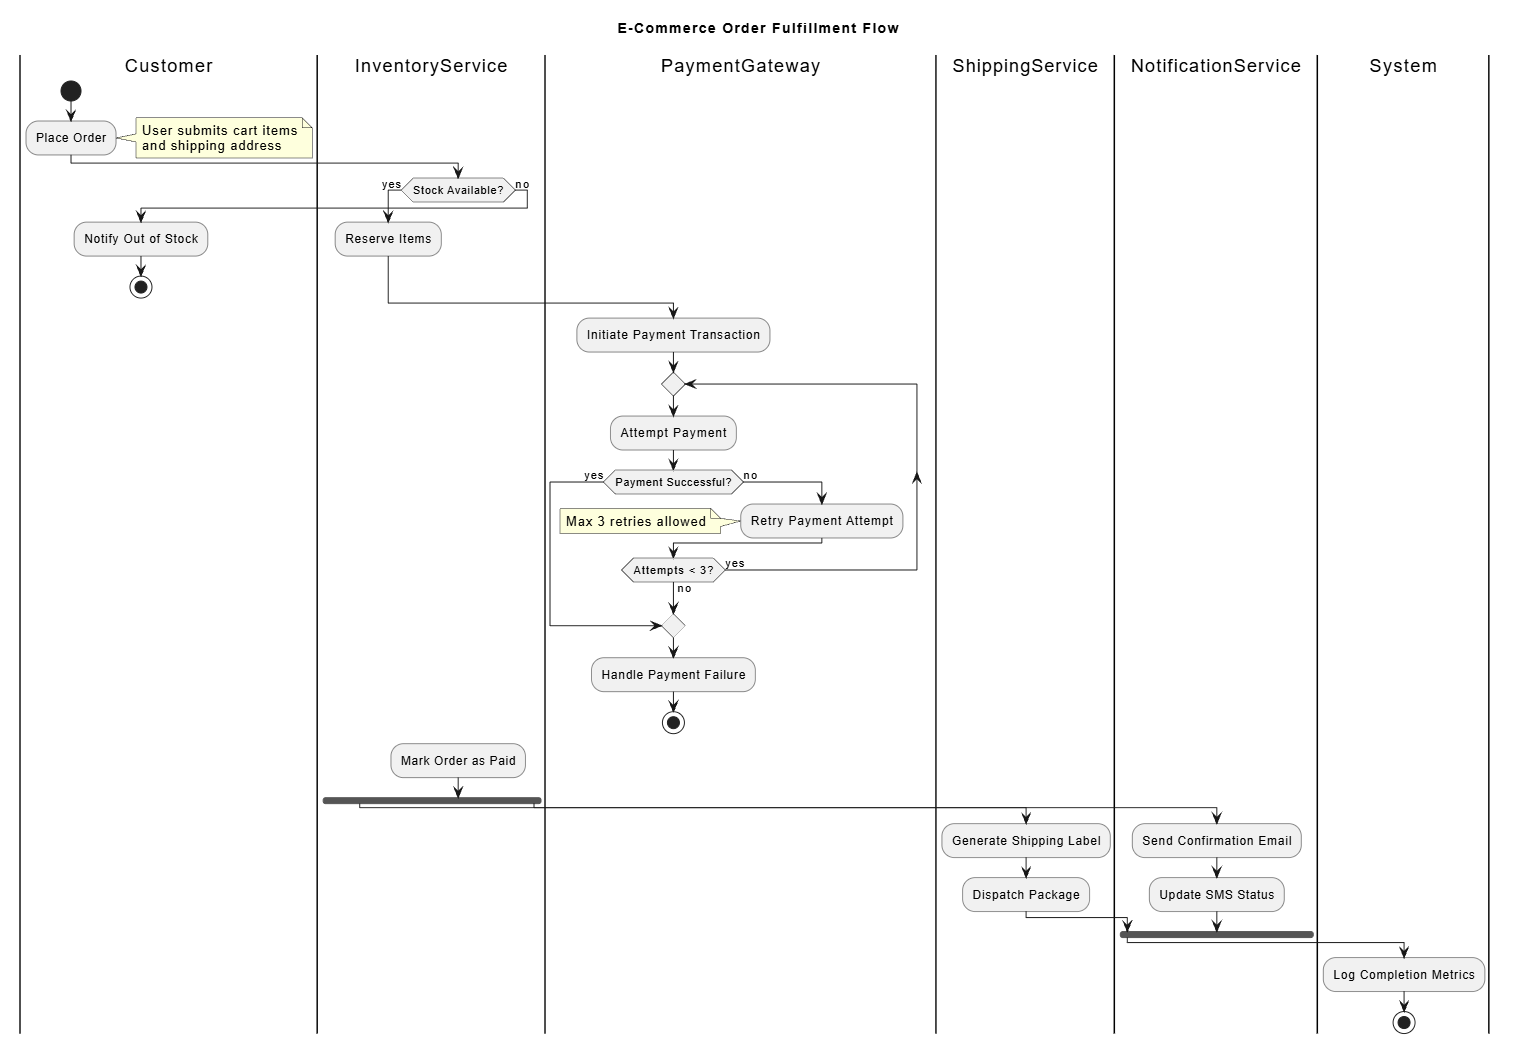
Comprehensive PlantUML Example: E-Commerce Order Fulfillment
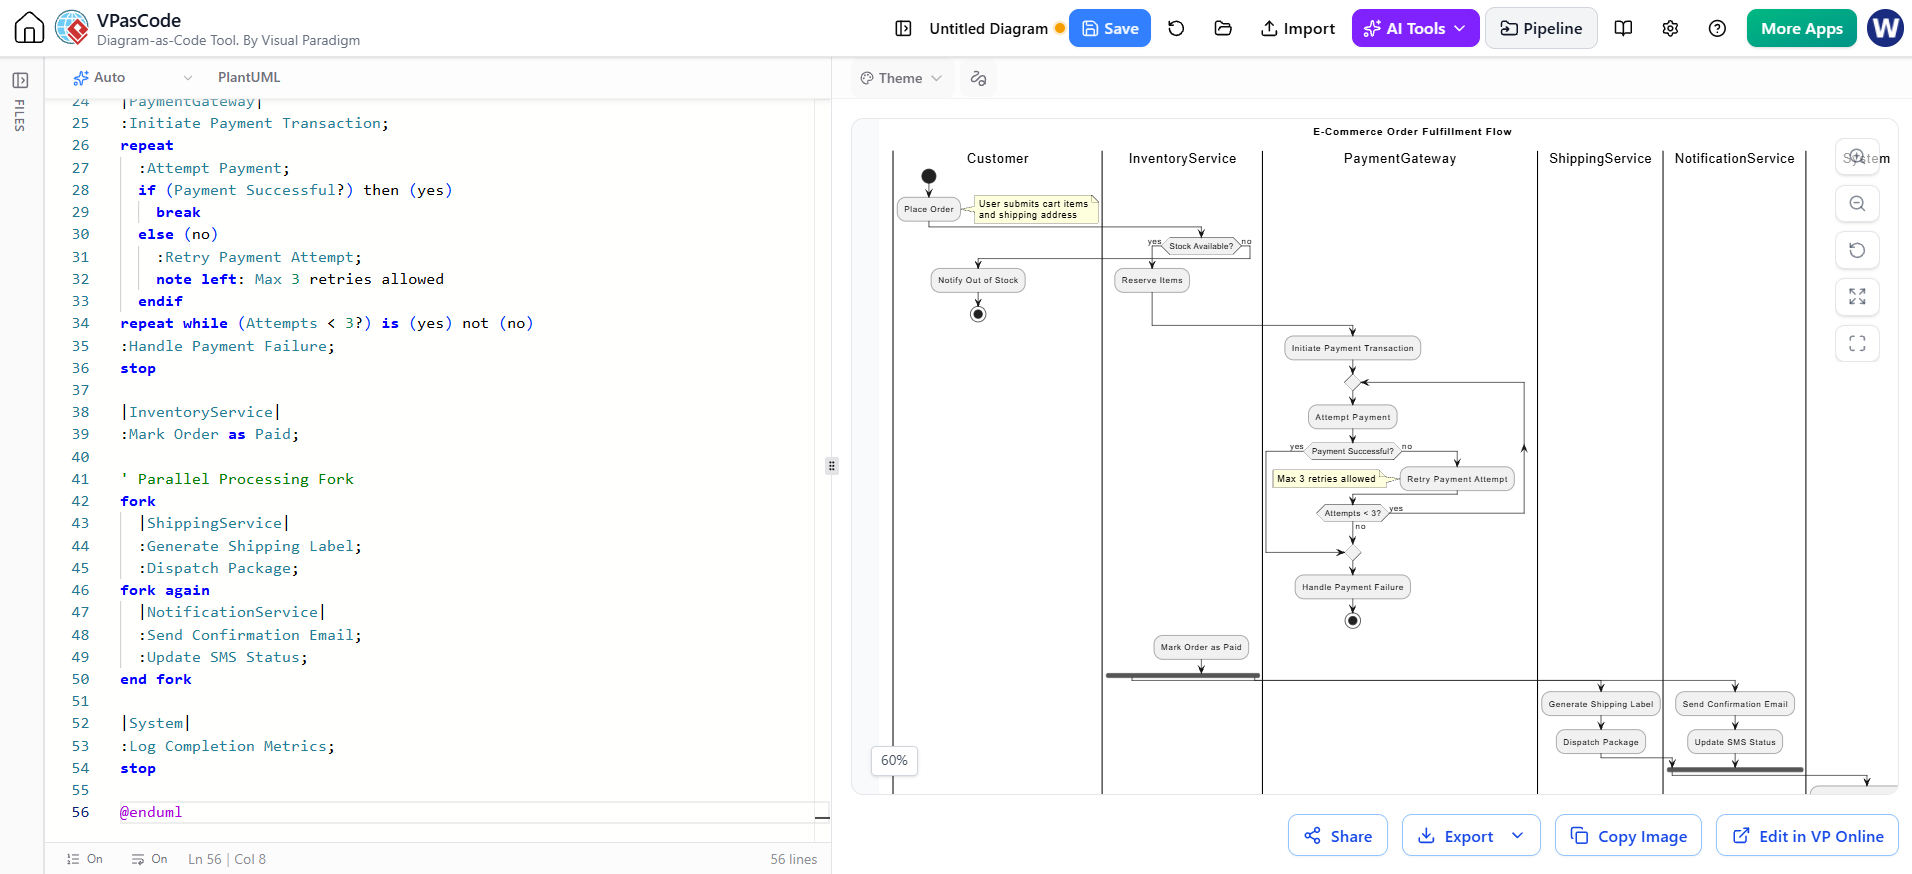
Below is a robust example demonstrating a full feature set: swimlanes for different departments, decision diamonds, parallel processing for inventory and payment, and loop handling for retries.
Render the Flowchart in BPMN Swimlane Diagram in VPasCode Tool:
@startuml
title E-Commerce Order Fulfillment Flow

' Define Swimlanes for Actors/Systems
skinparam activity {
  BackgroundColor<<Customer>> LightBlue
  BackgroundColor<<InventoryService>> LightGreen
  BackgroundColor<<PaymentGateway>> LightYellow
}

|Customer|
start
:Place Order;
note right: User submits cart items\nand shipping address

|InventoryService|
if (Stock Available?) then (<yes>)
  :Reserve Items;
else (<no>)
  |Customer|
  :Notify Out of Stock;
  stop
endif

|PaymentGateway|
:Initiate Payment Transaction;
repeat
  if (Payment Successful?) then (<yes>)
    break
  else (<no>)
    :Retry Payment Attempt;
    note left: Max 3 retries allowed
  endif
repeat while (Attempts < 3?) is (>yes)
-> No;
stop

|InventoryService|
:Release Reservation;
:Mark Order as Paid;

' Parallel Processing Fork
fork
  |ShippingService|
  :Generate Shipping Label;
  :Dispatch Package;
end fork
fork again
  |NotificationService|
  :Send Confirmation Email;
  :Update SMS Status;
end fork

|System|
:Log Completion Metrics;
stop

@enduml
Export the Flowchart as full size of BPMN Swimlane Diagram by the VPasCode:
Breakdown of the PlantUML Syntax Used:
-
Swimlanes (
|Actor|): Visually separates duties betweenCustomer,InventoryService,PaymentGateway, etc. This clarifies ownership of each step. -
Conditional Logic (
if...then...else): Maps directly to diamond shapes in standard flowcharts but handles nested conditions cleanly. -
Loops (
repeat...while): Explicitly shows retry mechanisms, preventing infinite loop ambiguities common in static drawings. -
Concurrency (
fork/end fork): Demonstrates that shipping label generation and email notifications happen simultaneously after payment success—a detail often missed in simple linear charts.
Integrating Both Approaches: Best Practices
To maximize efficiency, combine the strengths of both methodologies:
-
Discovery Phase (Visual Paradigm AI): Use AI-generated charts during initial brainstorming sessions with non-technical stakeholders. These quick drafts help align on the “happy path” and major decision points without getting bogged down in syntax.
-
Specification Phase (PlantUML): Once the logic is agreed upon, translate the core flows into PlantUML code. Store these
.pumlfiles in your repository alongside the source code. -
Documentation Automation: Integrate PlantUML rendering into your CI/CD pipeline (e.g., using GitHub Actions). Every pull request that modifies backend logic should update the corresponding PlantUML file, ensuring documentation never drifts from reality.
Conclusion
Complex ideas do not need to remain obscure. Whether through the intuitive power of AI-assisted visual mapping in Visual Paradigm or the rigorous precision of PlantUML code-based diagrams, flowcharts serve as the bridge between confusion and clarity.
For Eddie Man and other seasoned professionals returning to the IT industry, mastering these tools offers a distinct advantage. They allow for rapid prototyping of product lines, efficient debugging of agentic workflows, and seamless collaboration with cross-functional teams. By choosing the right tool for the right stage—visual for alignment, code for maintenance—you ensure that every process, from kidney dialysis scheduling algorithms to enterprise meeting summarizers, remains transparent, auditable, and easy to follow.